Sign-Up.to provides a wealth of statistics for each email campaign that you send. We recommend analysing your campaign results regularly, as these can help you identify important trends, key customer groups, your best performing promotions and much more.
When viewing your detailed campaign reports you can click on each number to view more detailed information, an explanation of the statistic and any additional reports which are available.
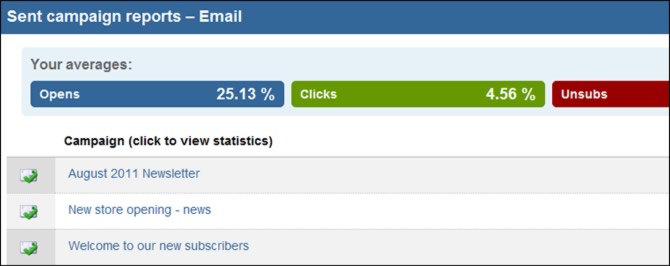
First head over to Analyse where you'll see a list of your campaigns under the 'Sent campaign reports – email' heading. To view more in-depth details for a specific campaign, click the campaign name.
Below is a breakdown of information you'll see on the next page.
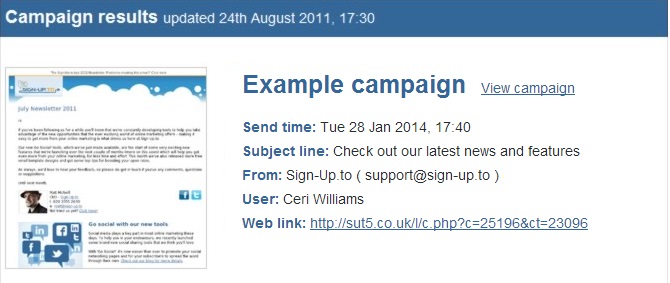
At the top of the page you will see a thumbnail image of the campaign as well as a recap of basic details, including the subject line and the time the email was sent. You can also see a preview by clicking the weblink.
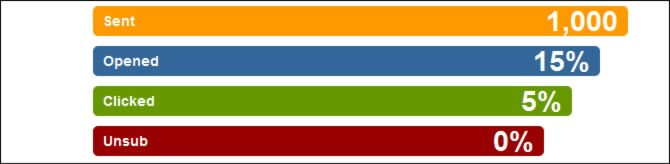
To the right of this you can see some quick statistics about how many people your campaign was sent to, as well as who opened, clicked and unsubscribed from your email.
Under key statistics you'll see a large amount of information covering the following:
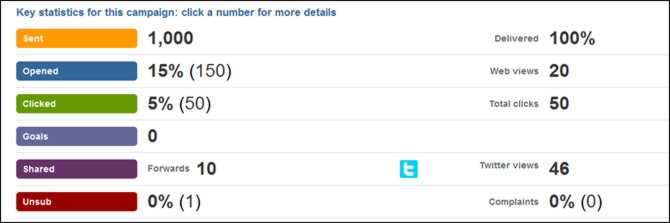
- Sent show you how many people your email was sent to as well as the deliverability on your email.
- Bounces are emails that we unfortunately haven't been able to deliver for a variety of reasons ranging from full inboxes to invalid email addresses. Bounces are divided into hard (or permanent) bounces, and soft (or temporary) bounces. Our systems constantly monitor bounces, automatically suspending or re-activating email addresses as appropriate to minimise your bills and preserve your reputation, maximising the effectiveness of your campaigns.
- Opens are measured when a recipient loads images or clicks links within your email campaign. As such, this is very much a minimum figure – plenty more recipients are likely to read your email, but unless they load images or click a link we can't be certain. This percentage is therefore most useful as a relative figure, permitting comparison within the Analysis section with your other campaigns, or on the Home page with our other customers in your industry.<
- Clicked shows how many people clicked the links within your email.
- Shared illustrates how many subscribers forwarded on the email to their friends. If you post your campaign on Twitter, you'll also see how many people viewed the campaign on Twitter.
- Unsubscriptions explain how many people unsubscribed from your mailing list as a result of the email you sent.<
With opened, clicked and the number of unsubscriptions, you'll be able to compare the figures with industry averages once the industry has been set. These figures are displayed on the right hand side of the page.
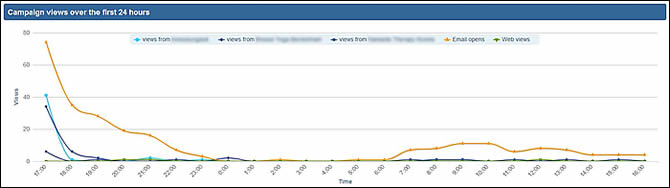
Underneath these stats you will see a graph displaying your email opens, web views and also views on any social media pages you have shared the campaign through. Each line on the graph can be toggled on or off by clicking its name.
Towards the bottom of the page is a box showing how many people clicked the links, and what links within your email campaign. There are lots of additional reports including targeting subscribers when they perform a specific action.